
Exploring the Design of Fertility Tracking Tools
This is the project I conducted under the mentorship of Professor Yunan Chen and Ph.D. candidate Mayara Costa Figueiredo (UC Irvine)
during the SURF-IoT fellowship, Summer 2019.
INTRO and MOTIVATION
Fertility mobile applications are getting more and more popular with a vast number of them released to the market, which makes it difficult for the users to navigate around and find the one that is best for them. Many of these mobile applications make no difference among the reasons for tracking the fertility cycle (e.g., conceiving, avoiding conception, understanding the cycle), which raises questions if they are adequately supporting this specific population. This highlights the need to understand how this population uses such tools and how these tools impact their experiences.
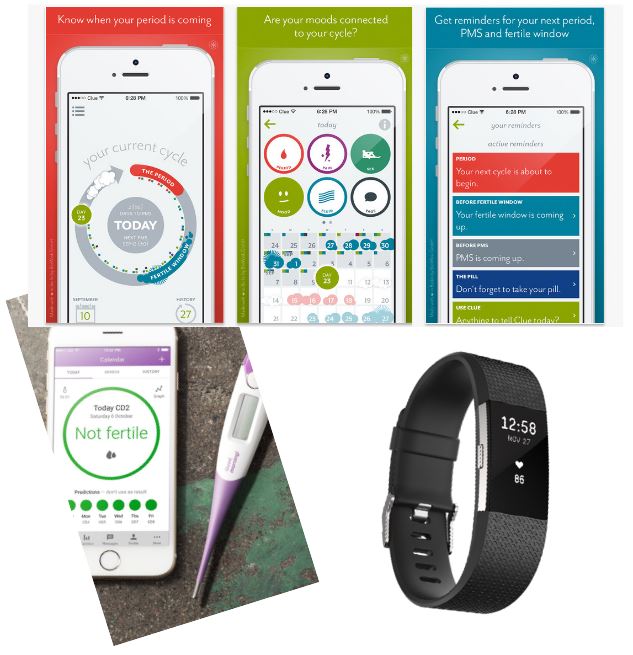
These apps, if being used properly, can help women understand their bodies and even detect their health problems early. Also, many apps support data synchronization with IoT devices like Fitbit, Ava, Wink…which makes the tracking process easier and faster. The purpose of our project is to explore the possible designs of the fertility app to elevate the users’ experience and offer them the ability to customize the app features in a way that meets their needs.
METHOD
To do this, we first chose the most popular apps on both Android and iOS platform (31 total) and conducted app evaluation to compare the goals that they claim to support and the tracking indicators they offer. We also downloaded and analyzed all the reviews of these apps then sorted them by goals, issues, positive aspects and keywords. This way, we can gain insight into what the users’ pain points are and in which way these apps could be improved.
RESULT
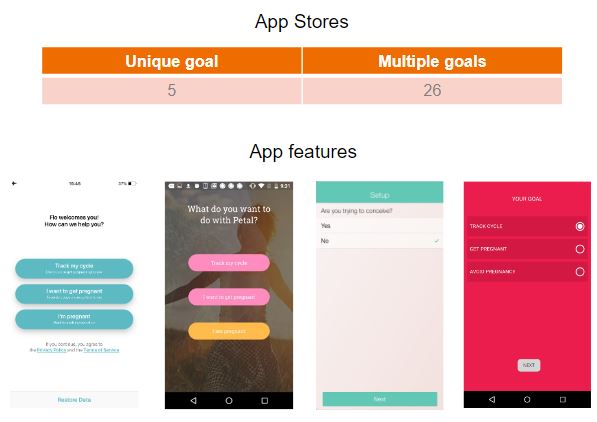
Based on the app store pages, period tracking is the most commonly offered goals (29/31), then Try to conceive (21/31) and Avoid conception which is 9. And only 7 apps offer the option to track pregnancy.
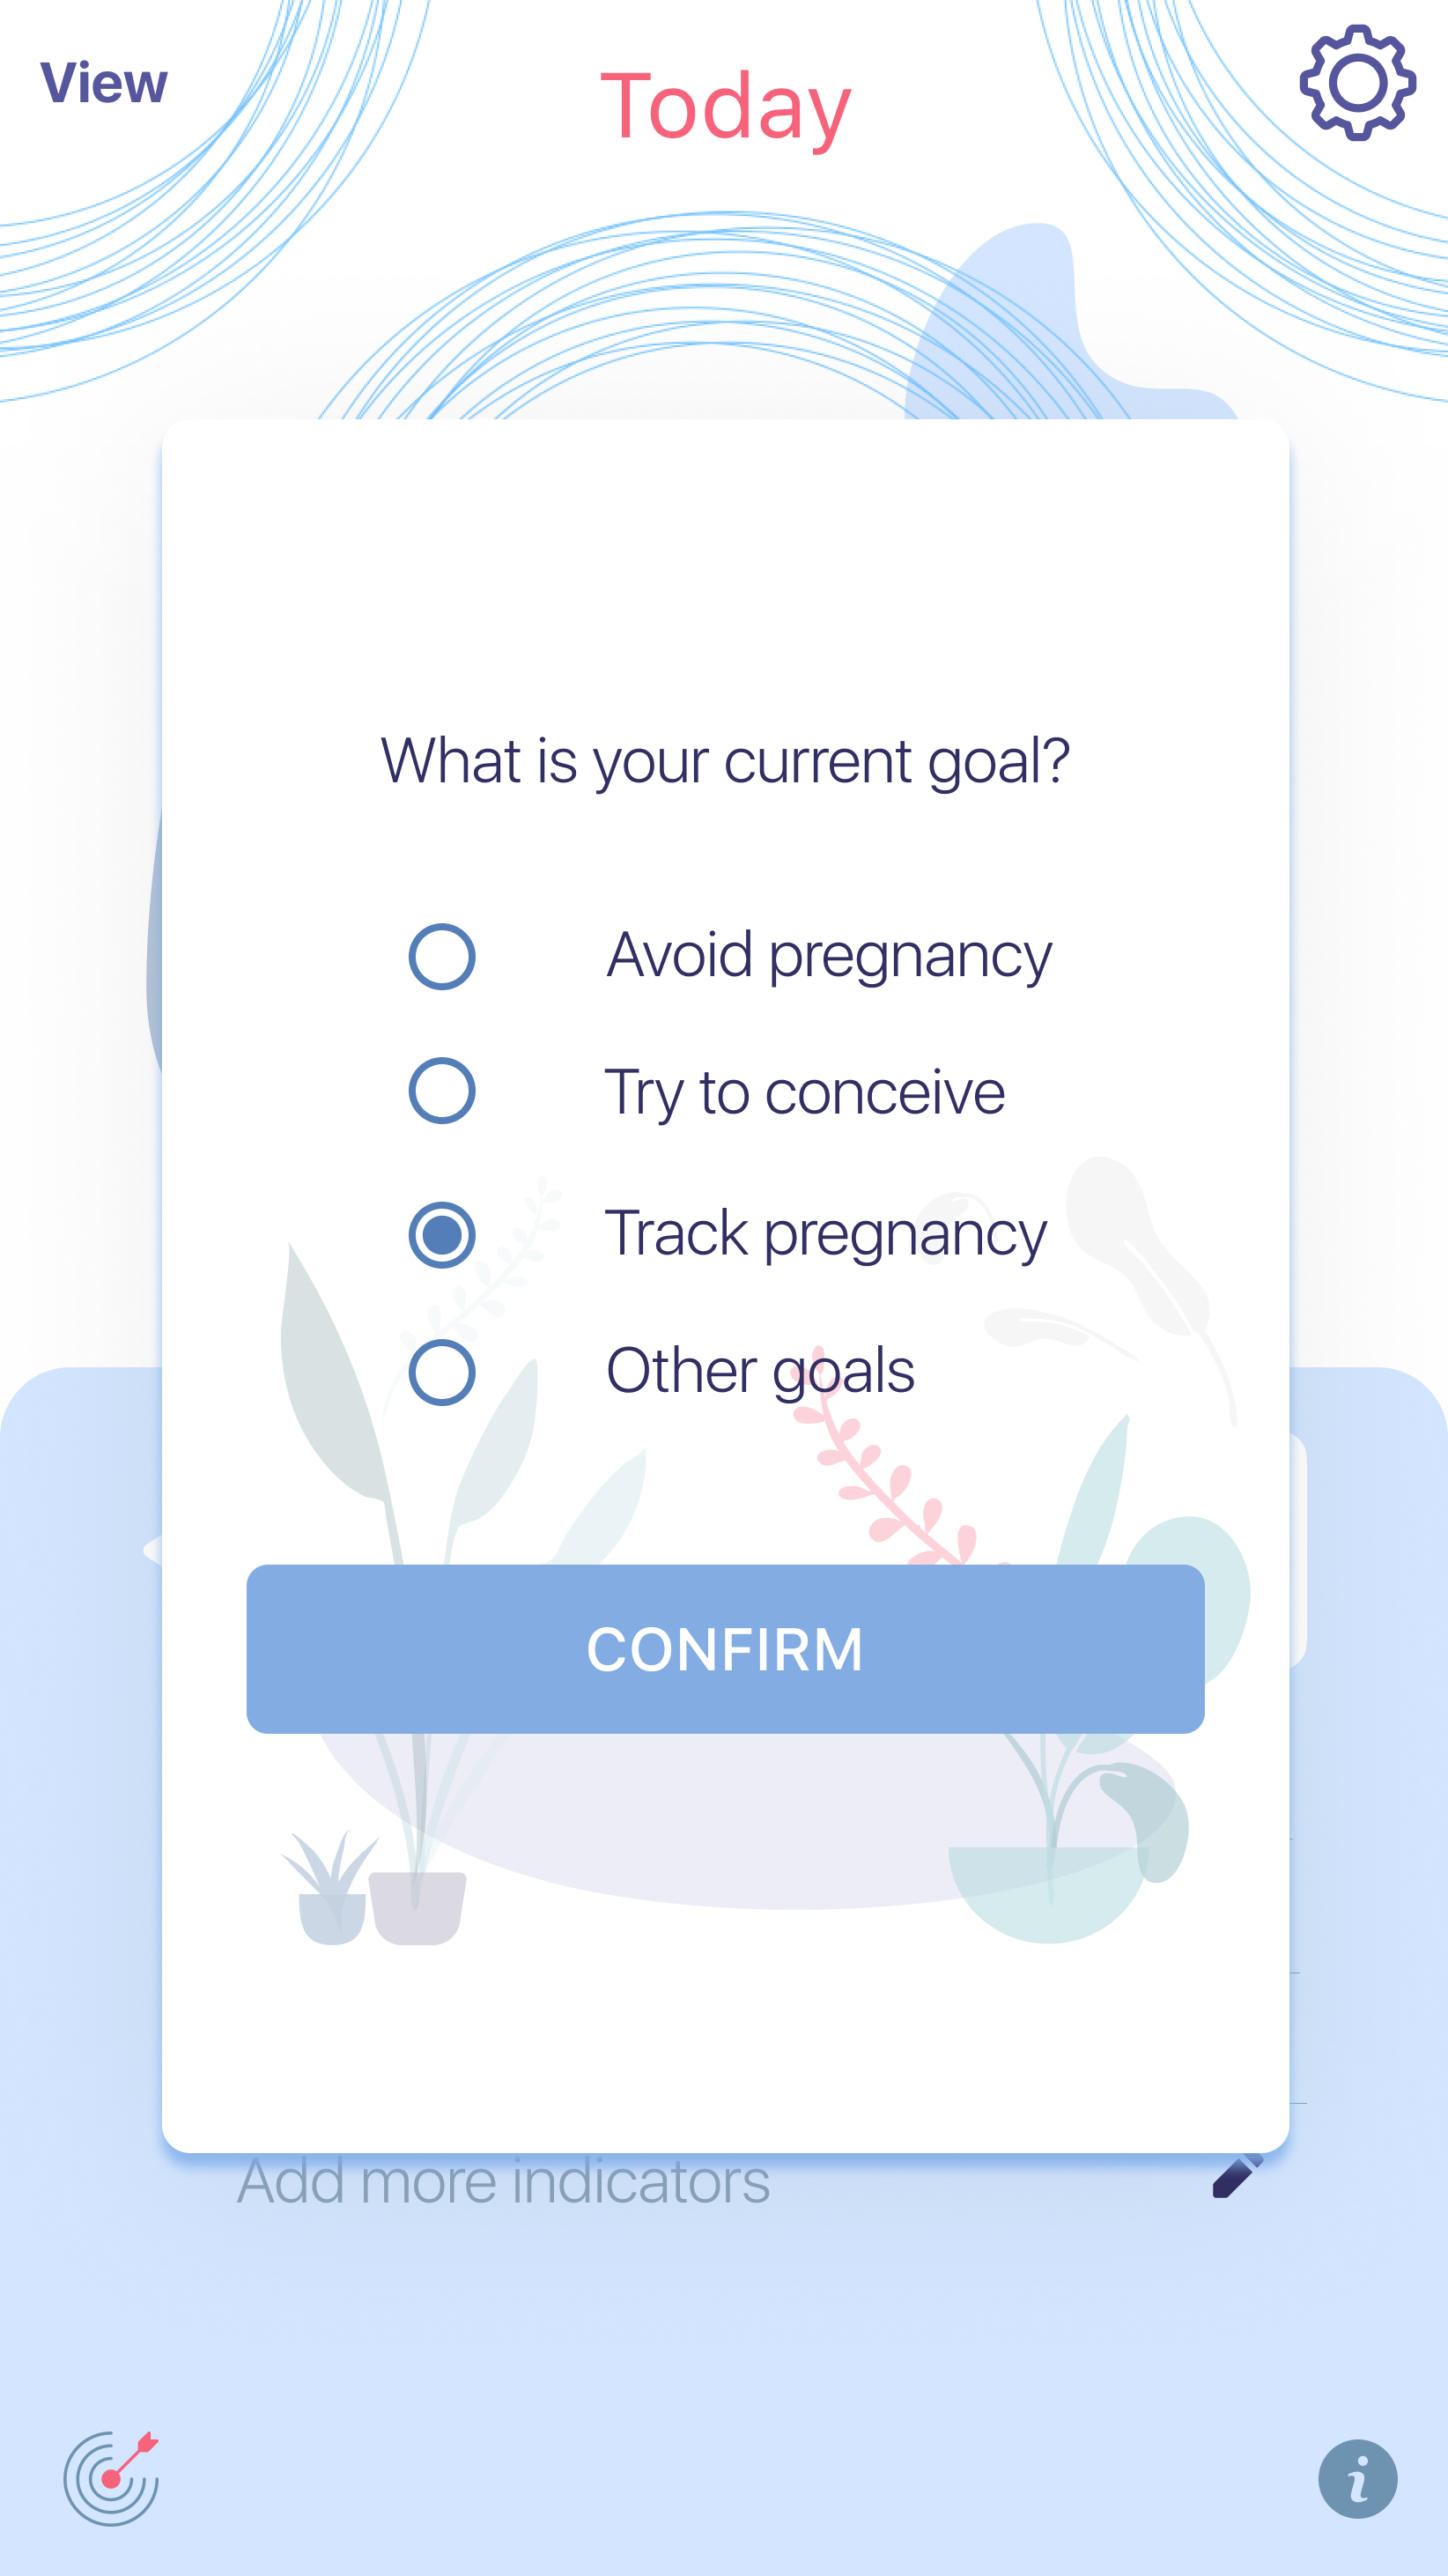
Note: Only 14 of them ask the user goal at the beginning, even though they claim to support multiple goals. Below are some examples of apps that do ask for the user’s goal:
Most of the time these apps uses a default interface for every cases; they lack the option to tailor the interface based on the users’ goals. Some reviews we got from the app stores related to the interface issue and the lack of pregnancy tracking:
“If I’m trying to prevent getting pregnant it won’t show me when I’m ovulating even if I put that I am not taking any birth control. So I have to choose the option for trying to conceive to be able to see my fertility window and avoid pregnancy”
“I wish it had an option for if you’re pregnant so that the app don’t keep telling you are period is late but over all great app”
Another thing we found after analyzing the reviews is that most women come to these apps with a holistic approach, which means they use them for multiple goals in different stages of their life. For instance, one may only track their period at first, but after getting married, they decide to try to conceive. And once they get pregnant, they probably want to track their pregnancy as well.
ISSUES and POTENTIAL SOLUTIONS
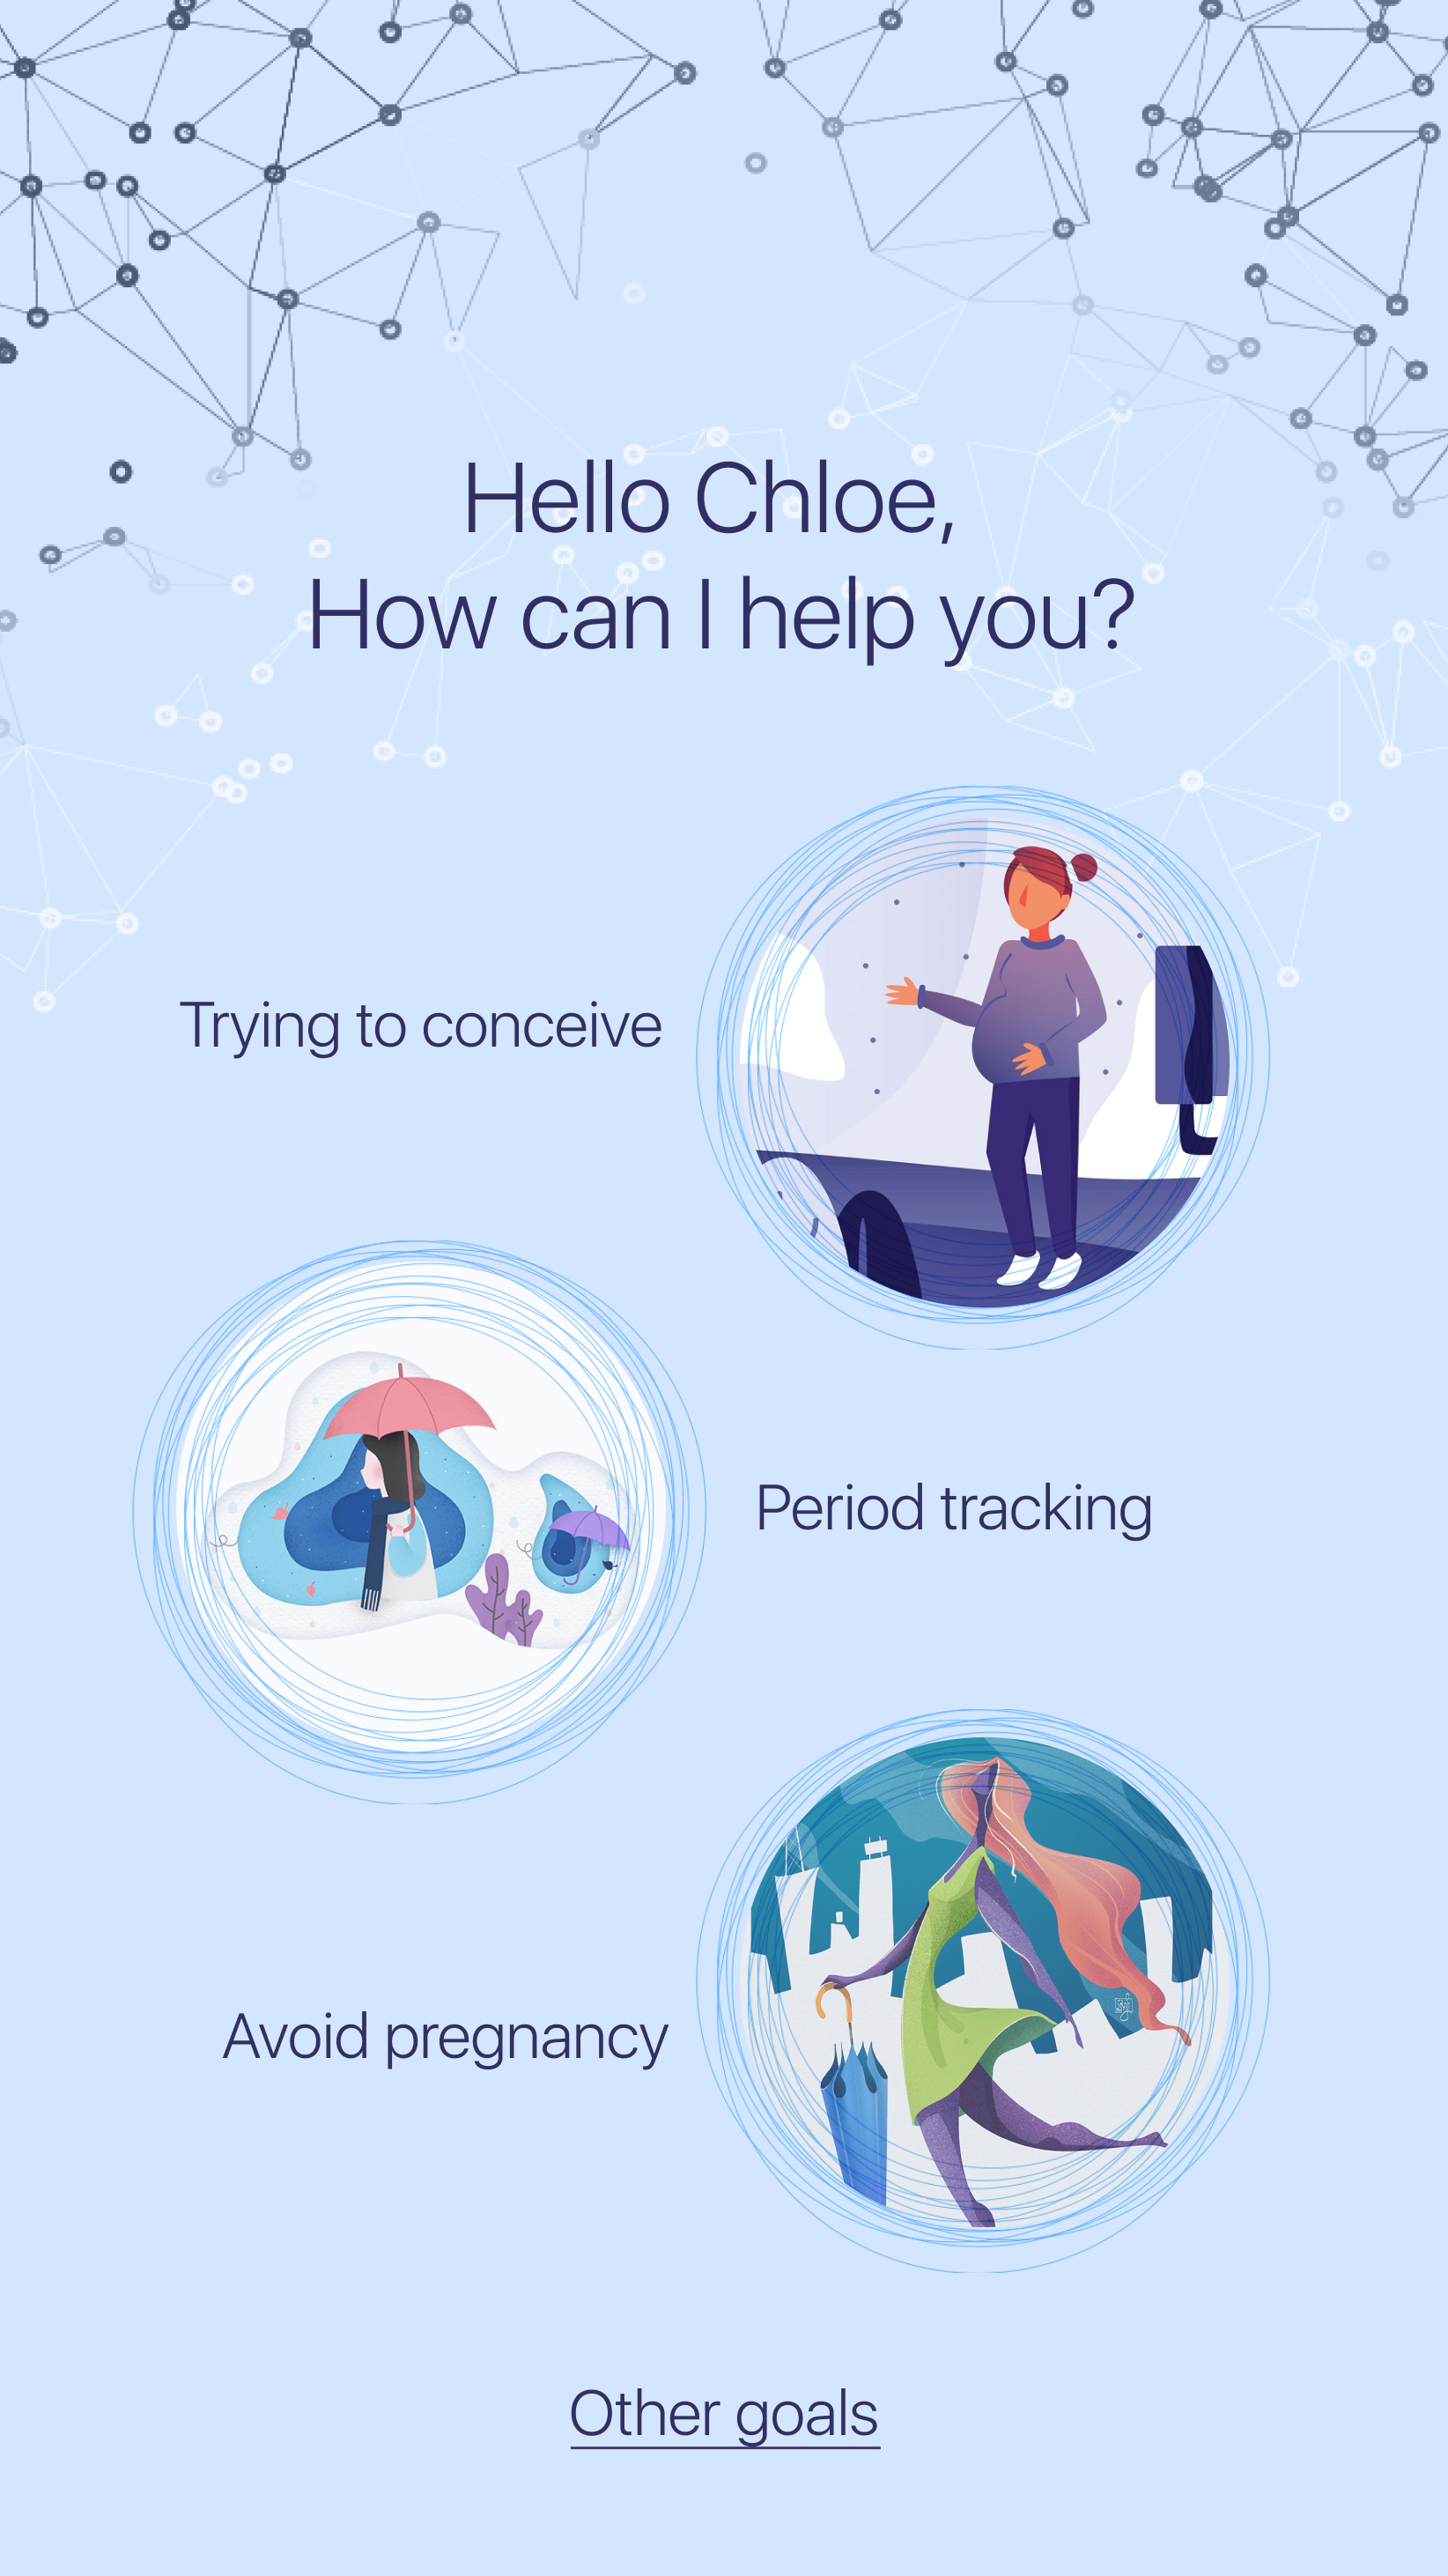
The first problem is selecting the goal, and people have different goals when they use the app. As I mentioned, among 31 only 14 apps ask the users what their goal is. The most common goals are Period Tracking, Trying To Conceive and Avoid pregnancy.
| Proposed design | |
|---|---|
| Besides asking their goal, our design also offer the ability to customize and create new goal. |
 |
After knowing the user’s goal, we have these goal-based interface. For Period tracking, the homepage will inform them when they have their period and the option to log their period, the default indicators in this mode are flow, moods, and symptoms, they can always add more indicators if they want. The icon at the lower right corner is for information about all the available indicators that the app offers. And the icon at the lower left is for instantly changing goal.
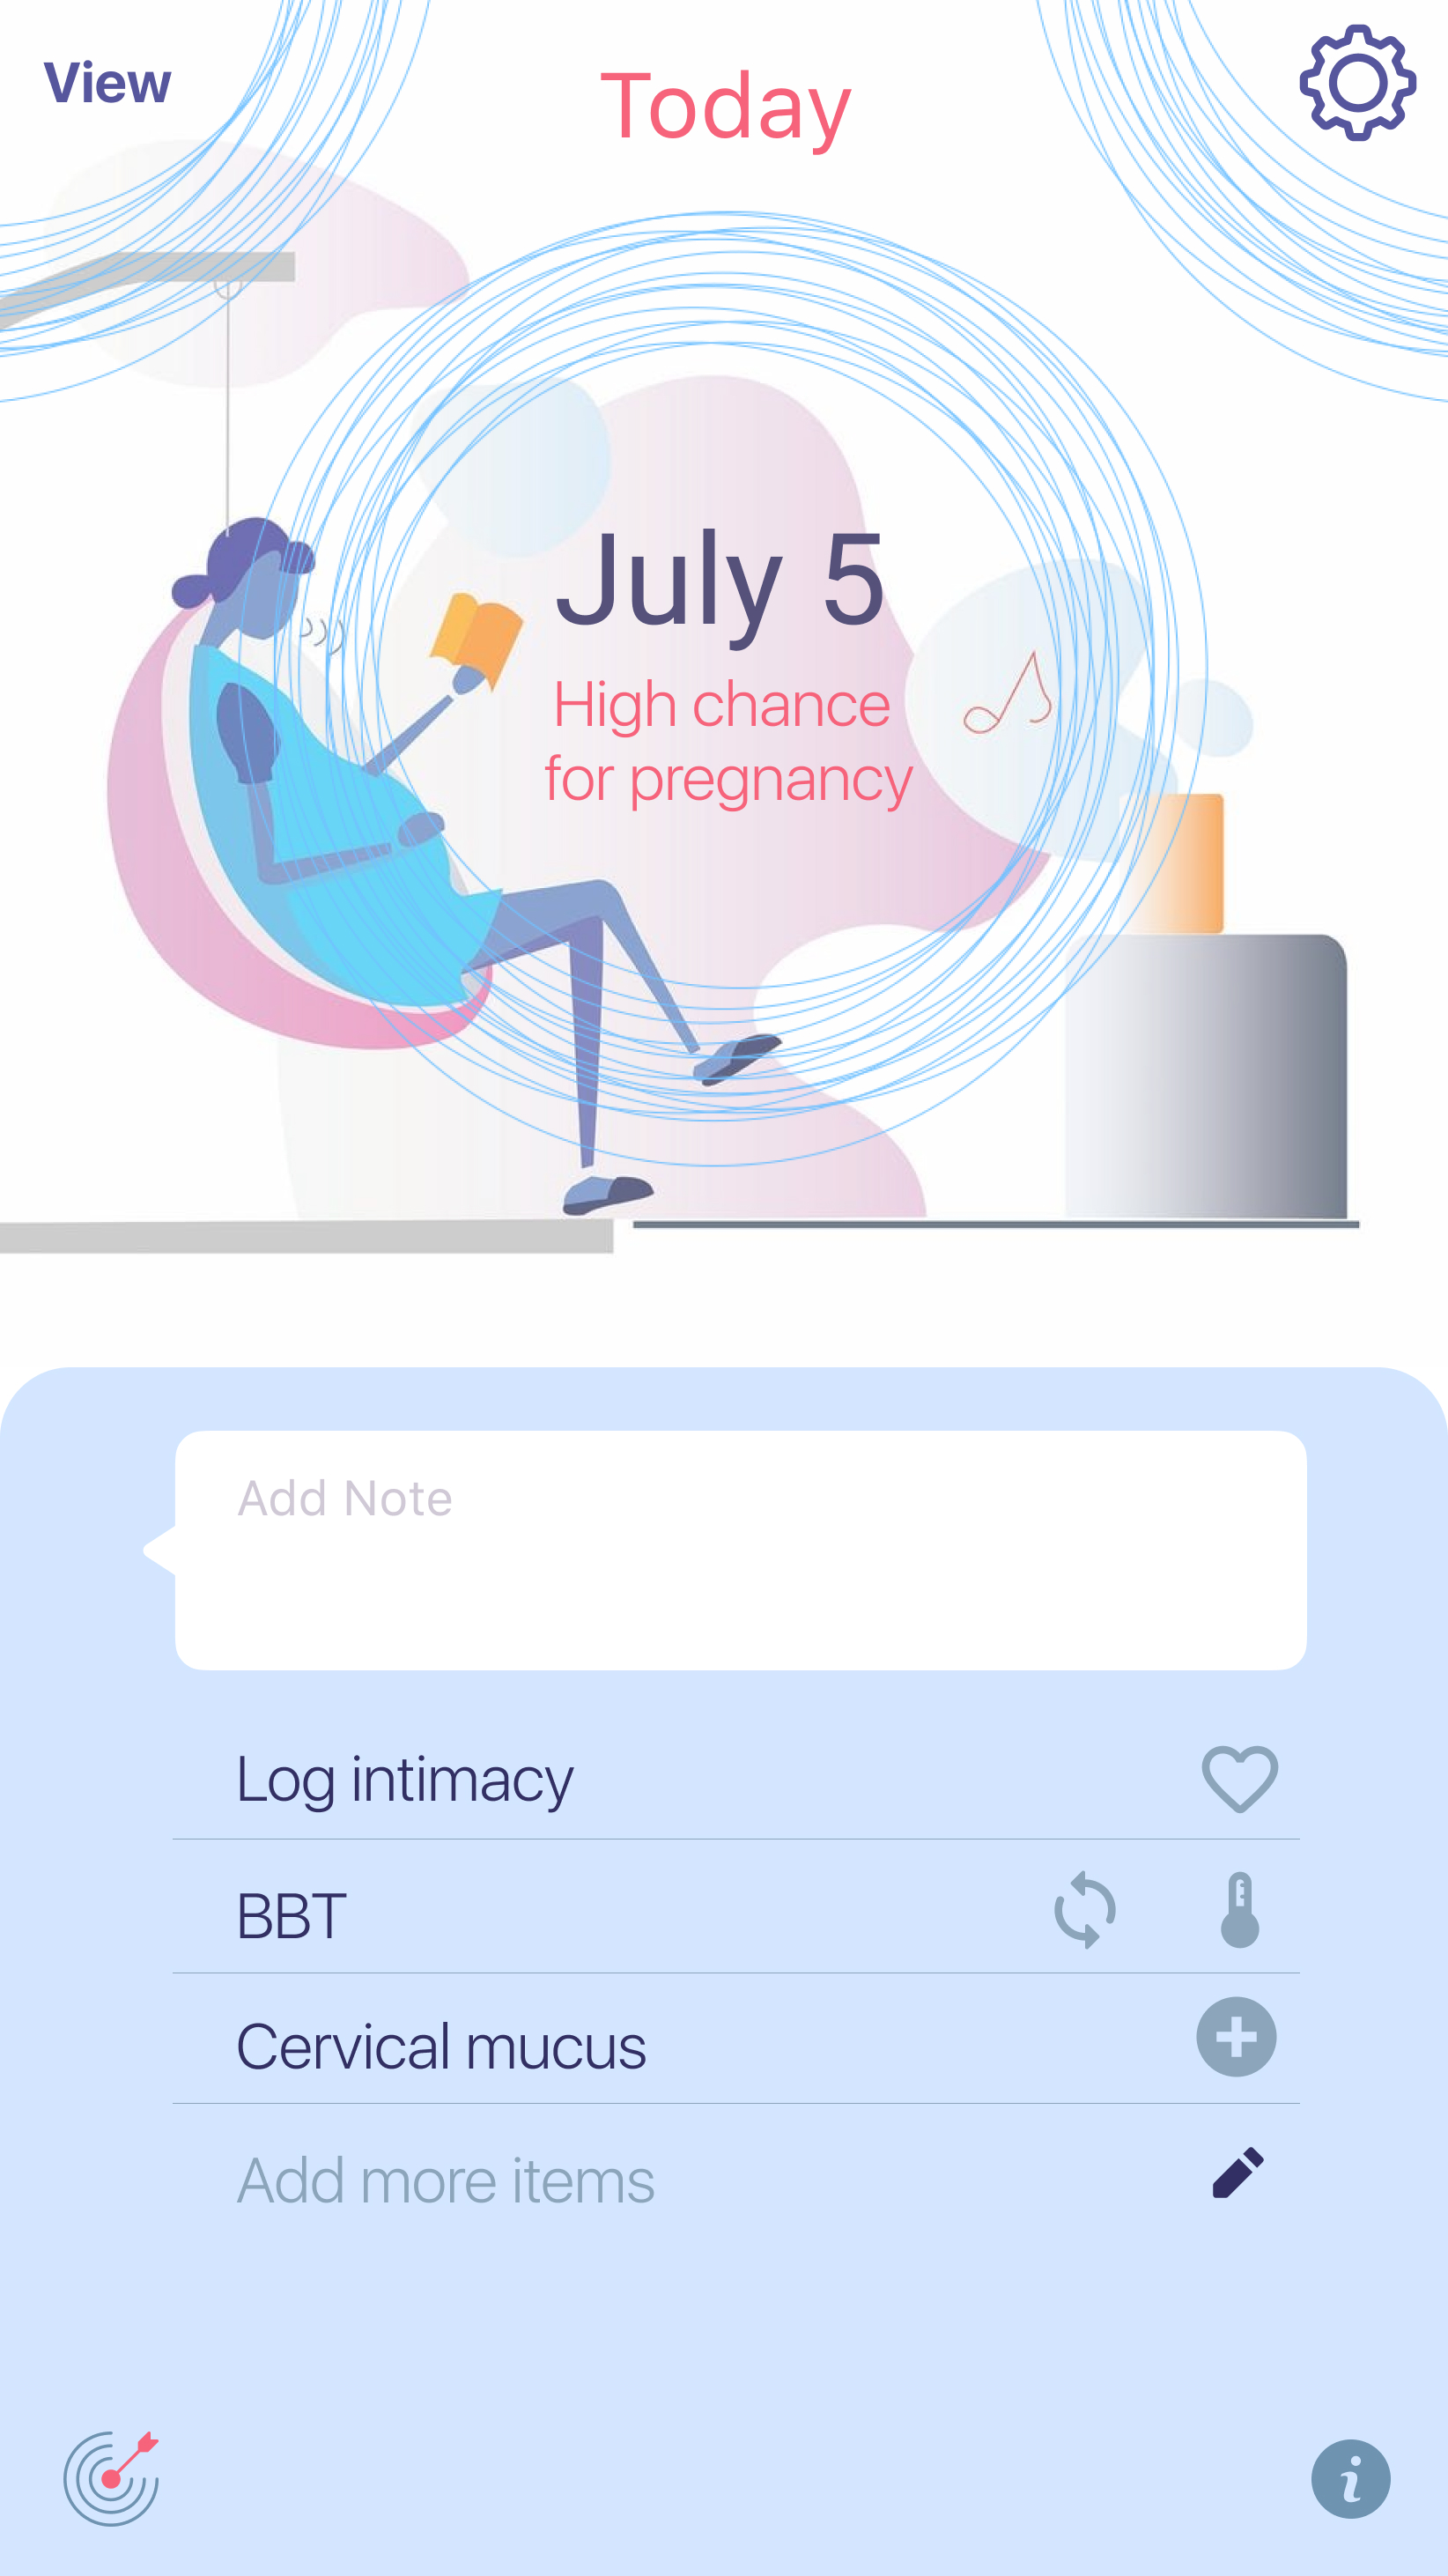
If the goal is Trying To Conceive, we inform the user whether that day is their fertile day, and the default indicators here are Intimacy logging, cervical mucus, BBT (could be either entered manually or syncing with devices)
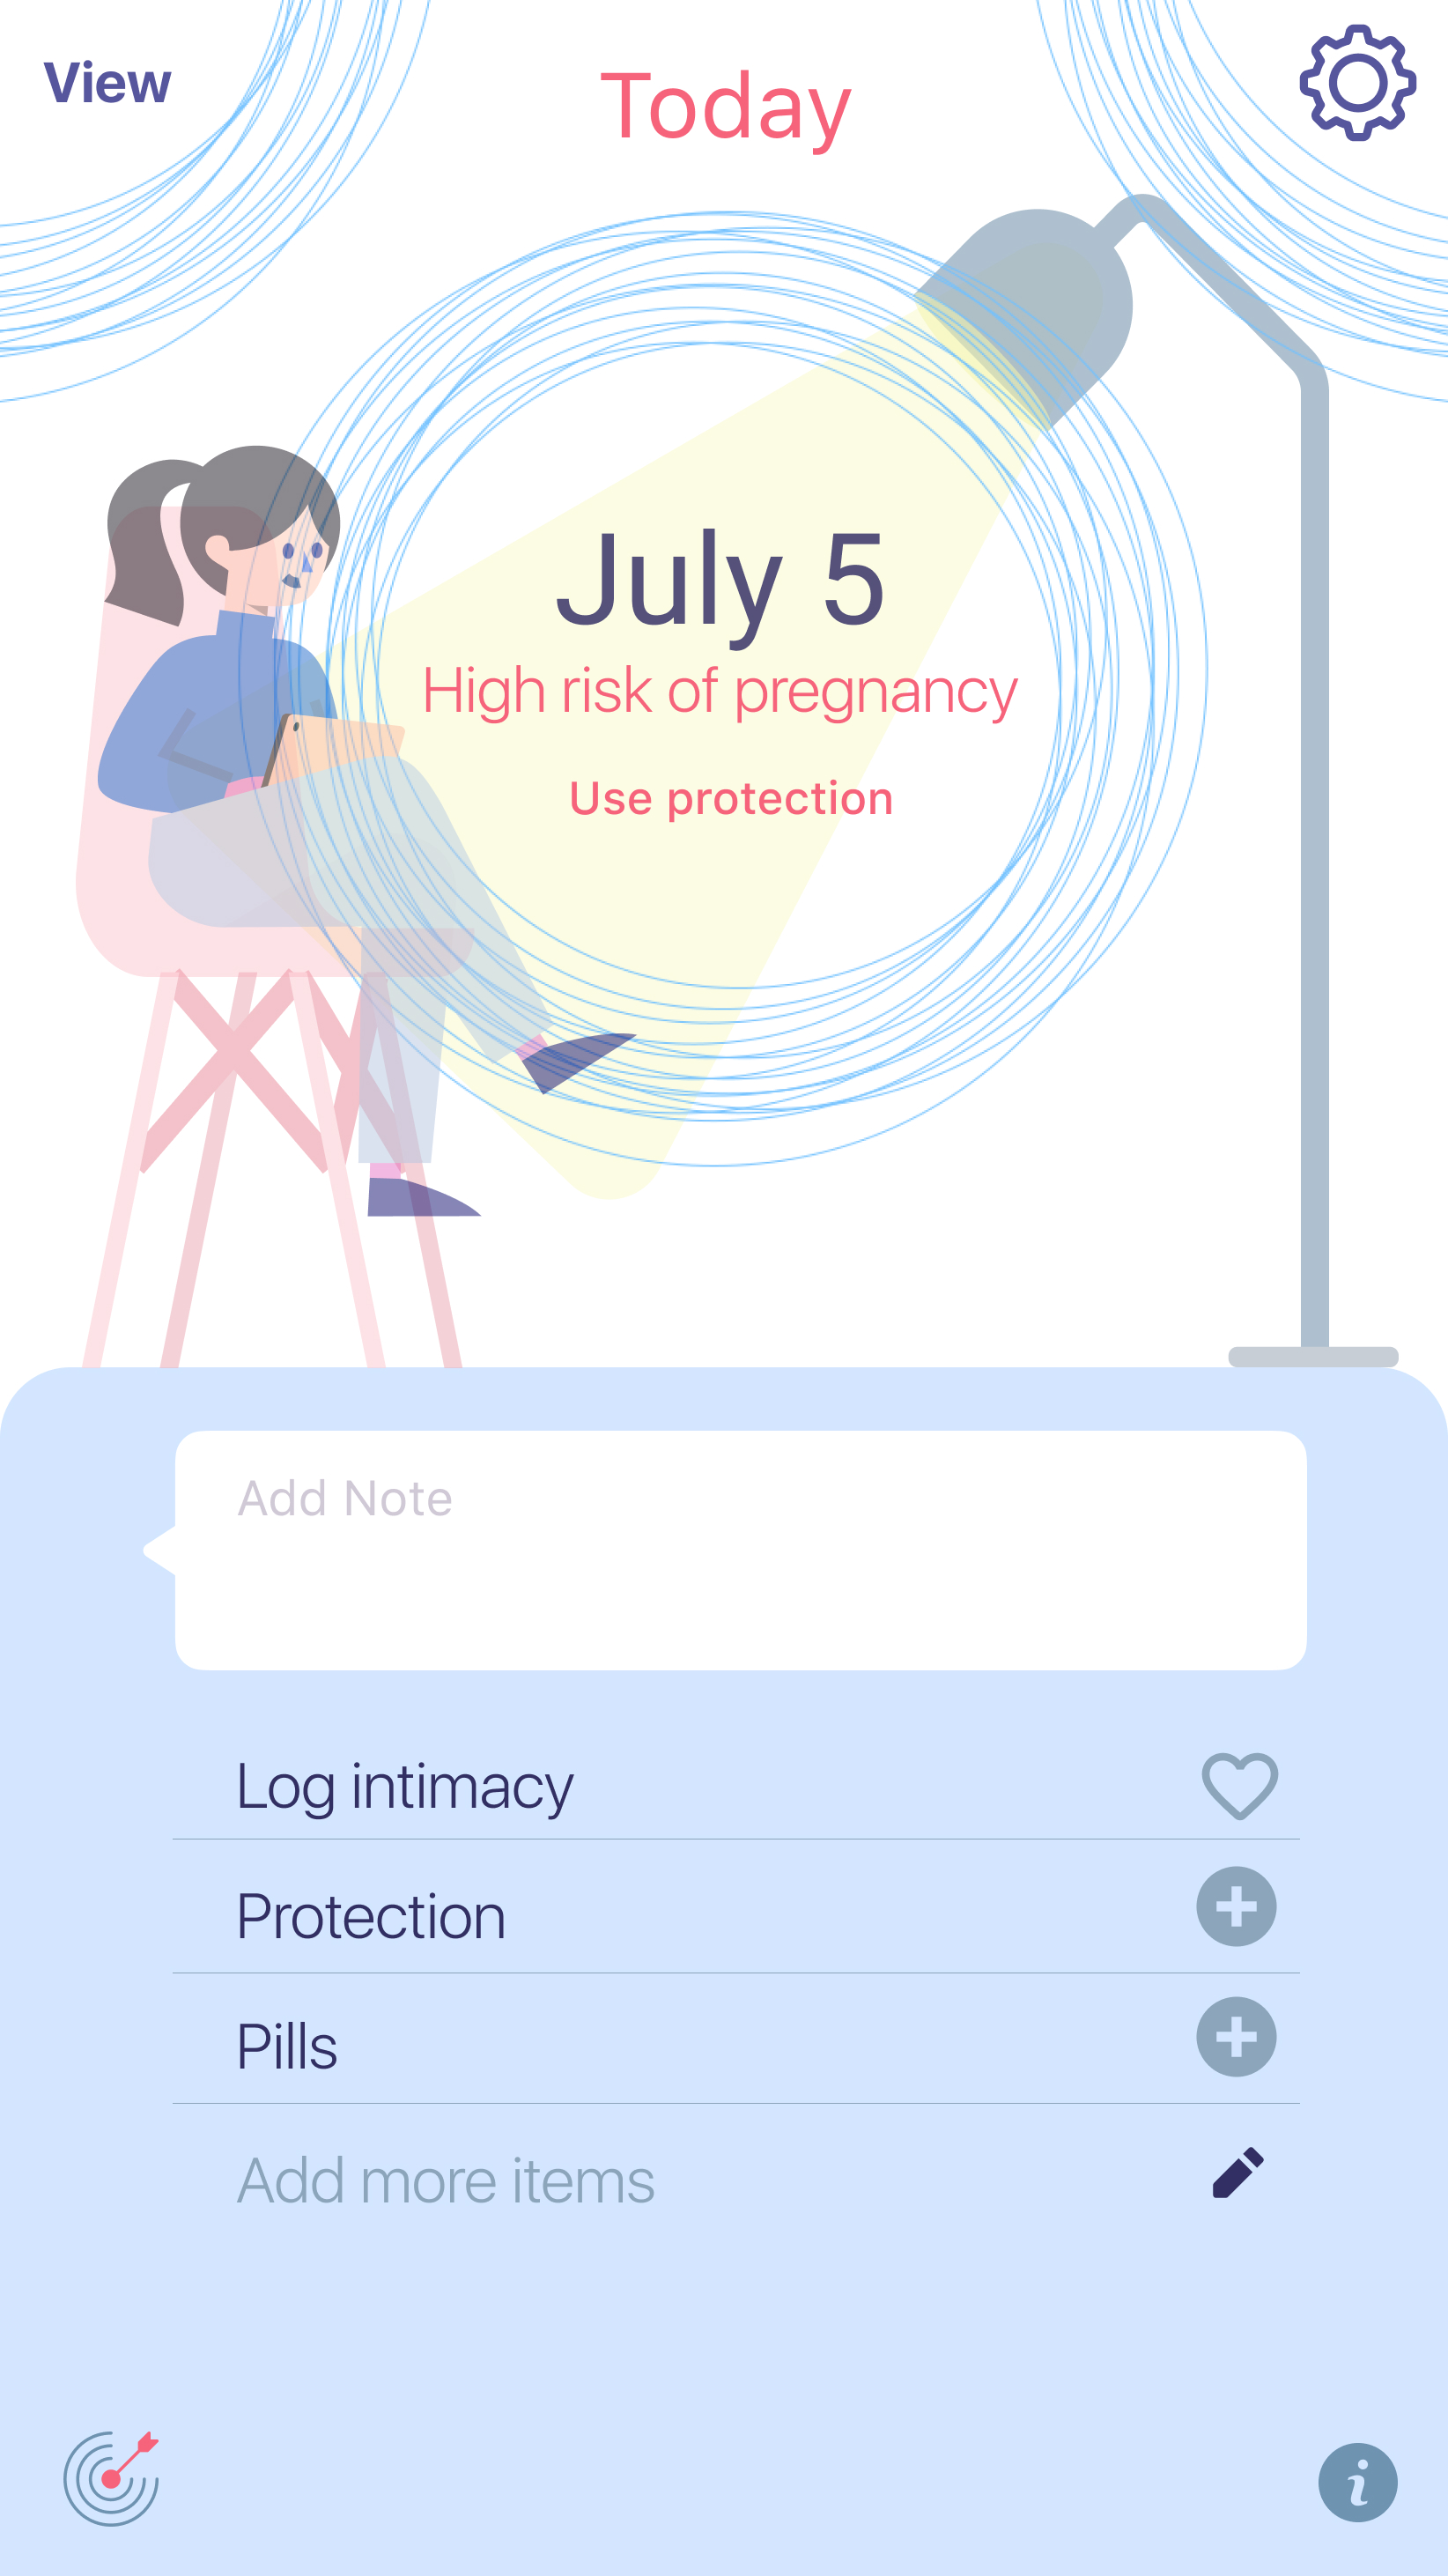
Similarly for Avoid Pregnancy, we warn them if that day they have high risk of pregnancy. And the default items are intimacy logging, Protection and Pills.
| Period Tracking | Trying to conceive | Avoid Pregnancy |
|---|---|---|
 |
 |
|
 |
 |
When we analyzed the reviews, the lack of pregnancy tracking option is one of the most common complaints. In our design, for pregnancy tracking, the homepage will tell the user where they are in the pregnancy, also the option to upload ultrasound pictures of their baby and to track their body measurements and nutrition intake.
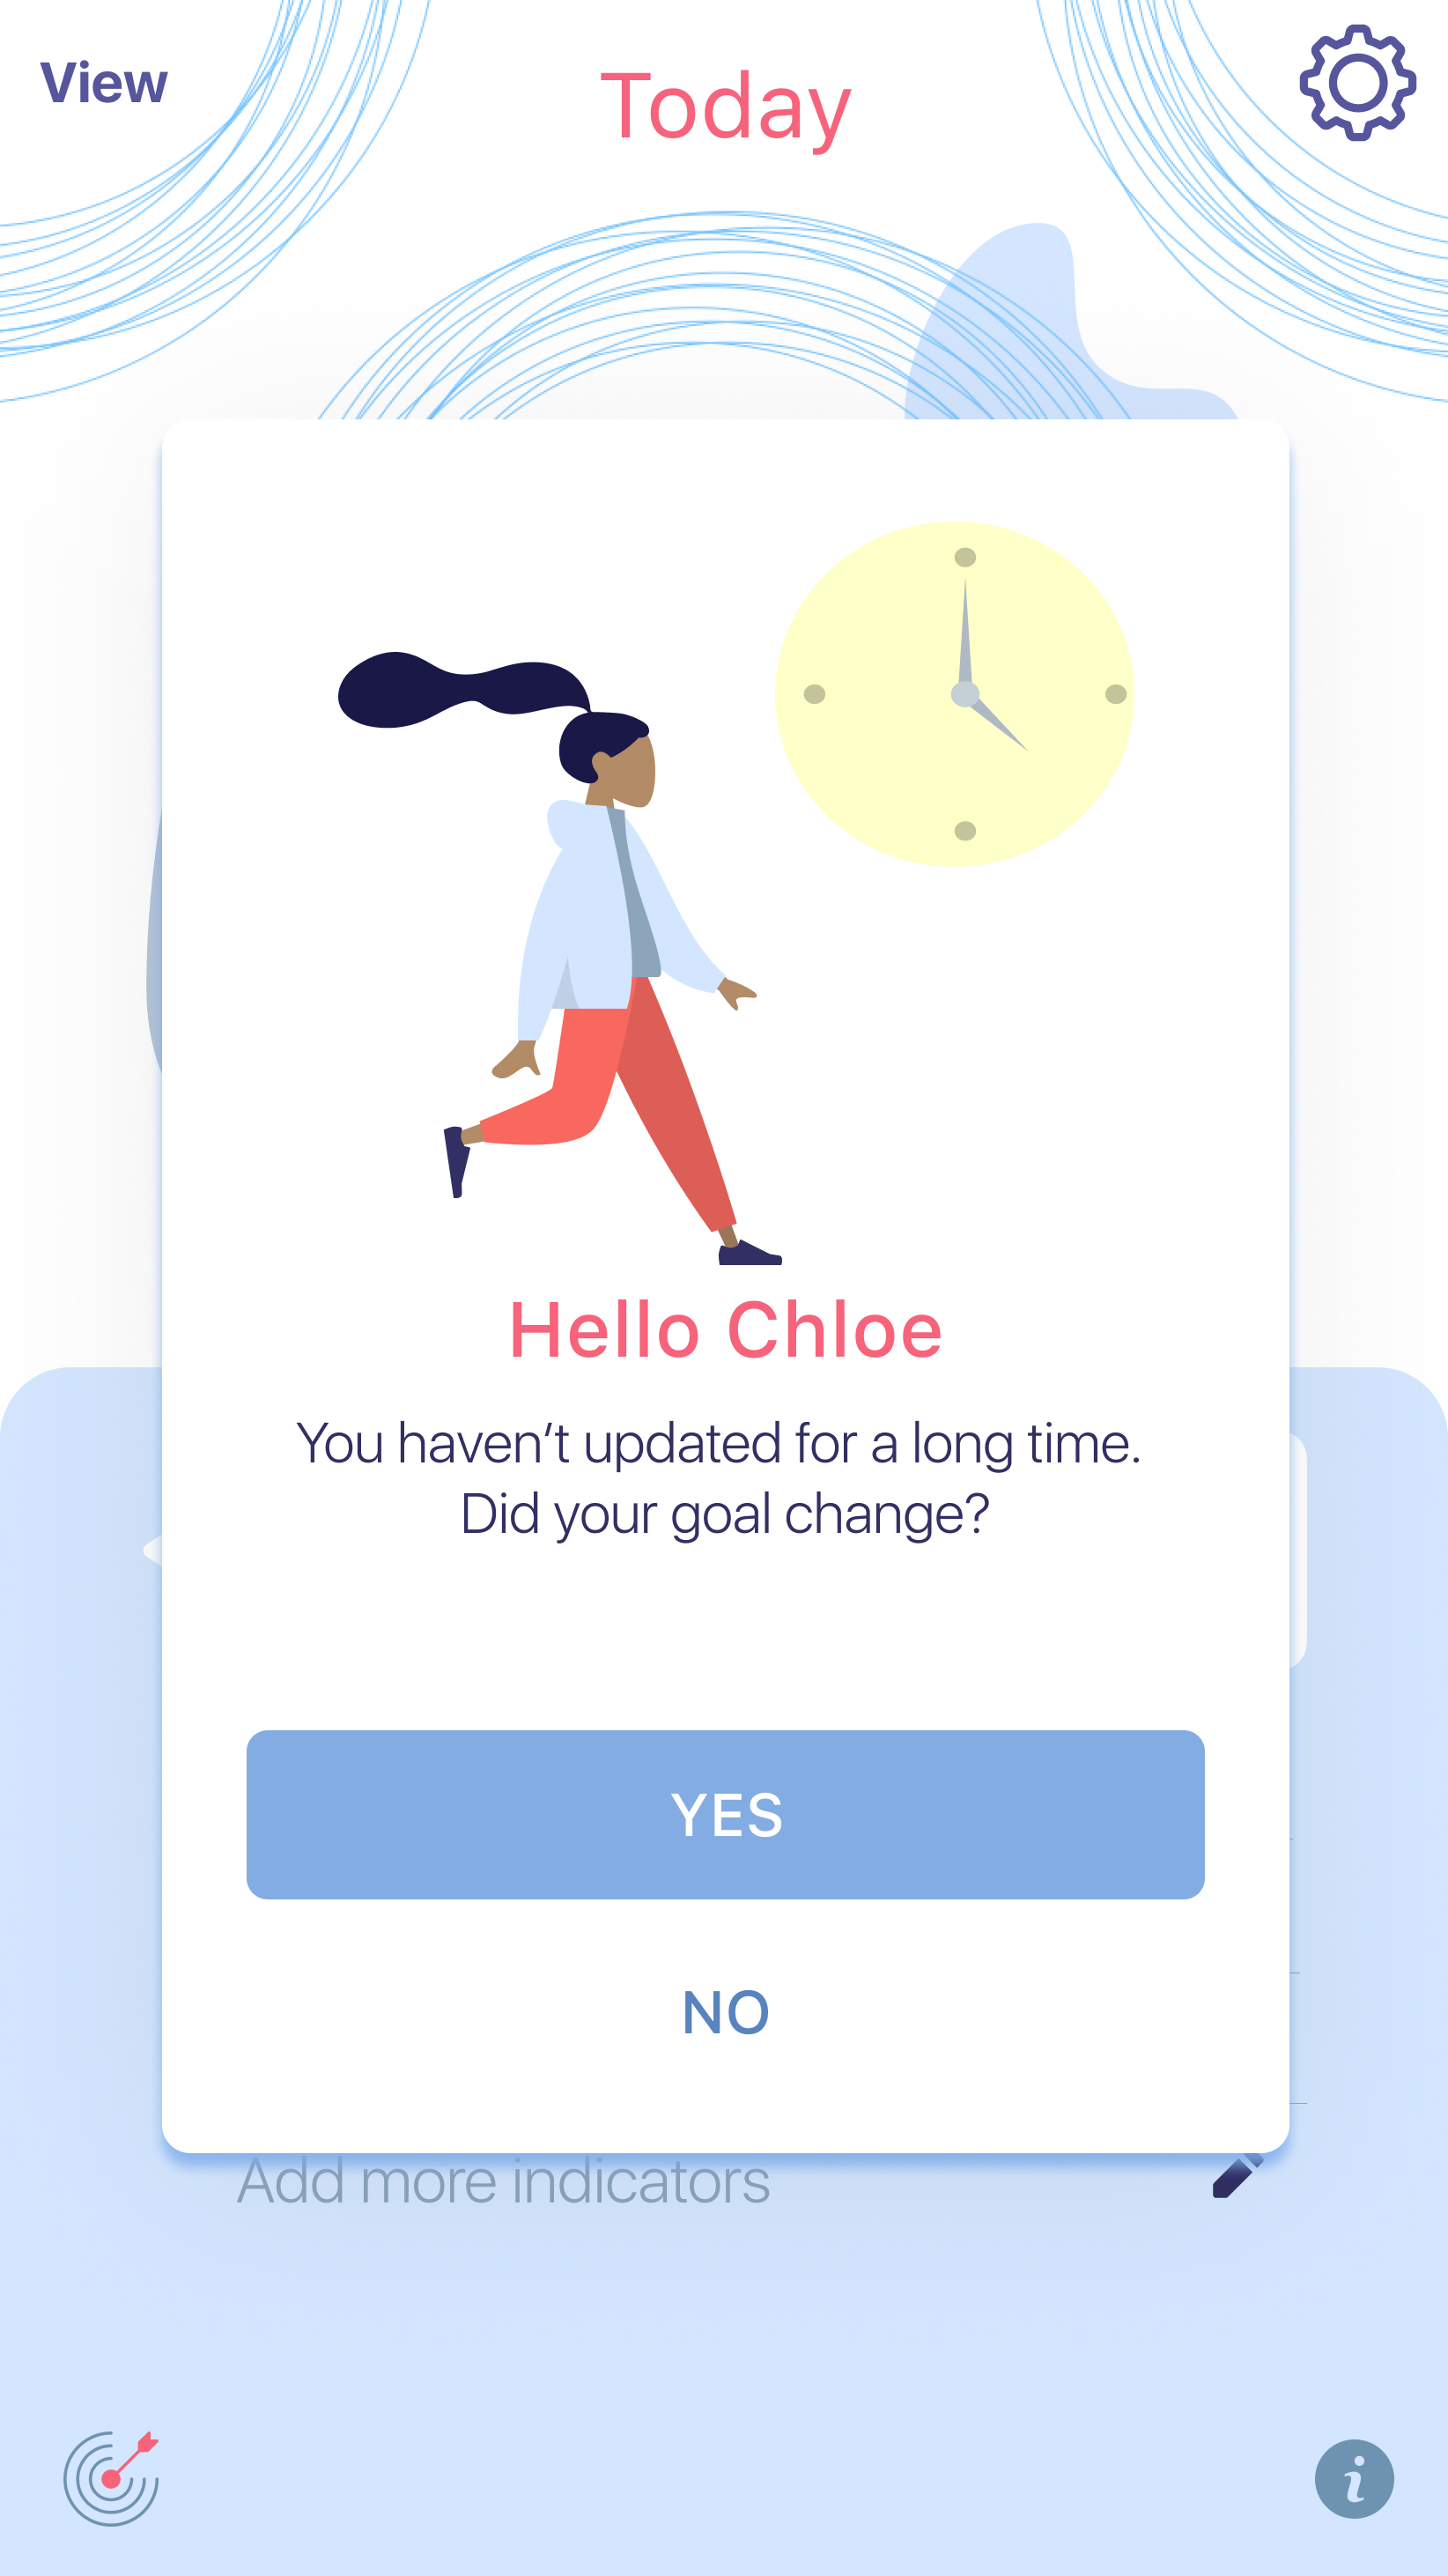
Goal detection is another feature that we added, for example, if the user hasn’t updated their period for a while, a popup screen will show up and ask if their goal changes. If they say yes, then the app will proceed to ask what their new goal is.
Or maybe they didn’t want to track their pregnancy and came back using the app to track period after their baby was born, there should be an option to ask if they want to reuse their last cycles for prediction or start from scratch.
| Pregnancy Tracking | Detect goal change | Set up new goal |
|---|---|---|
 |
 |
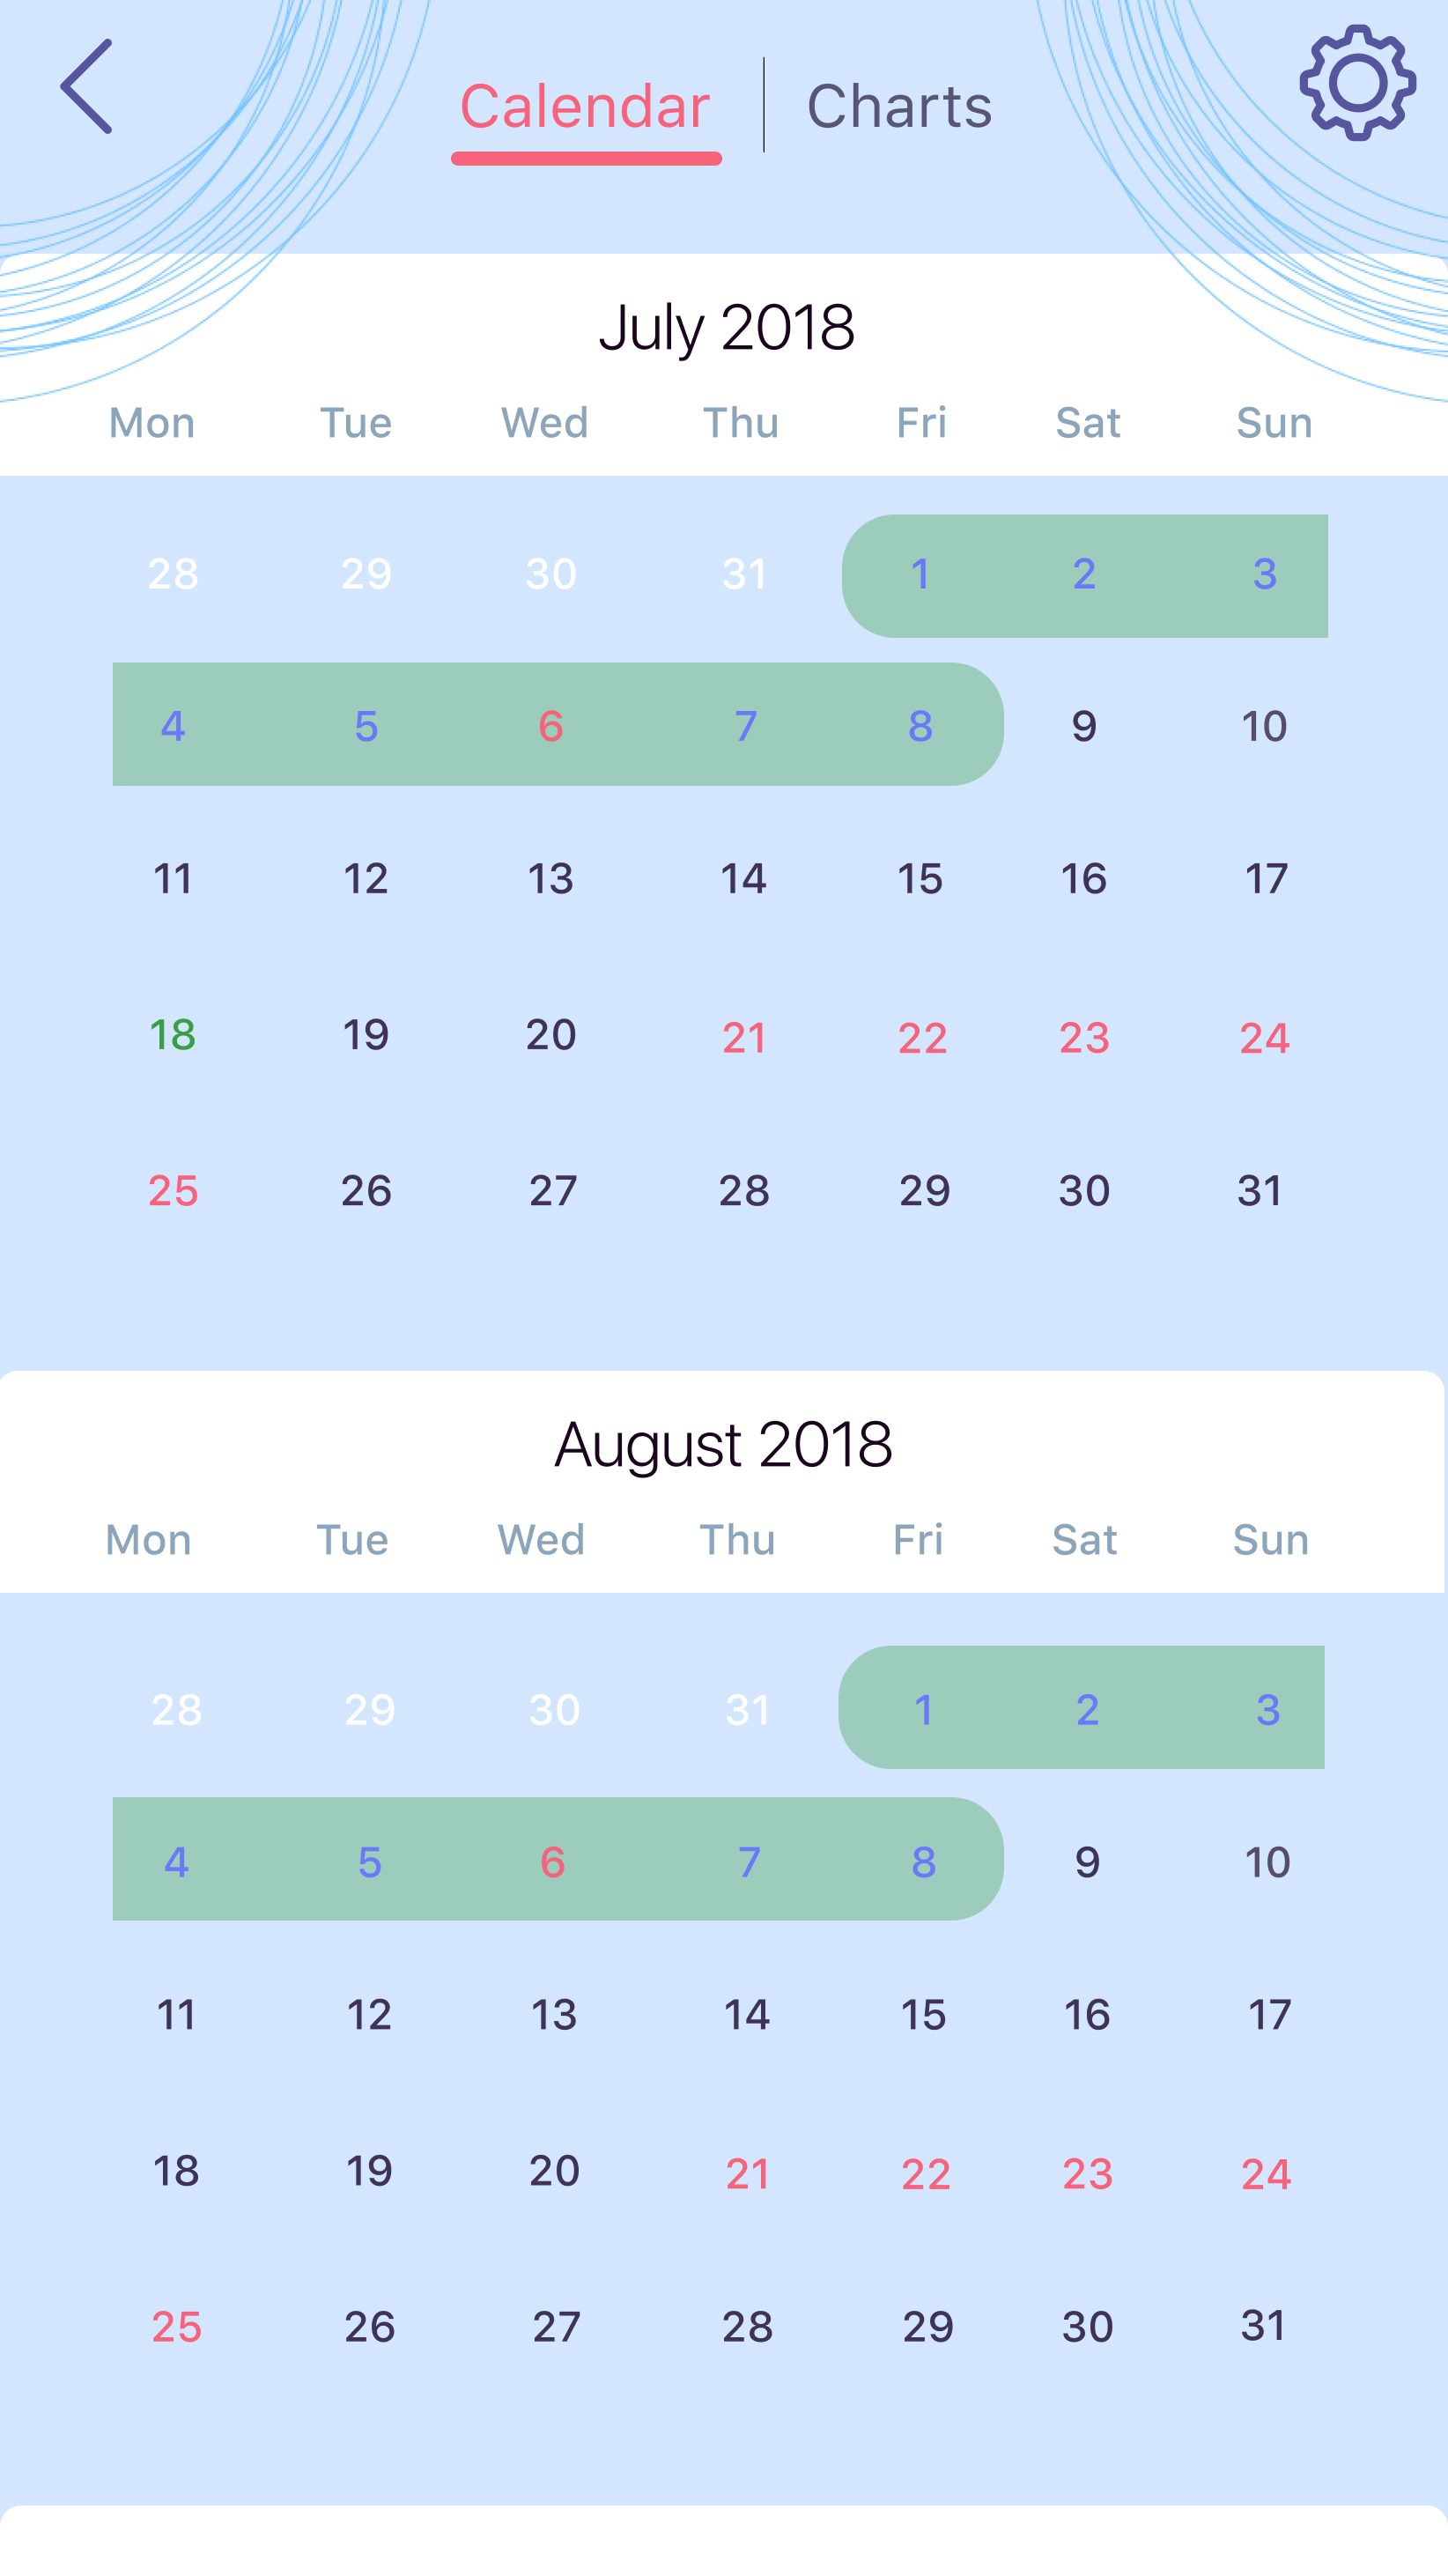
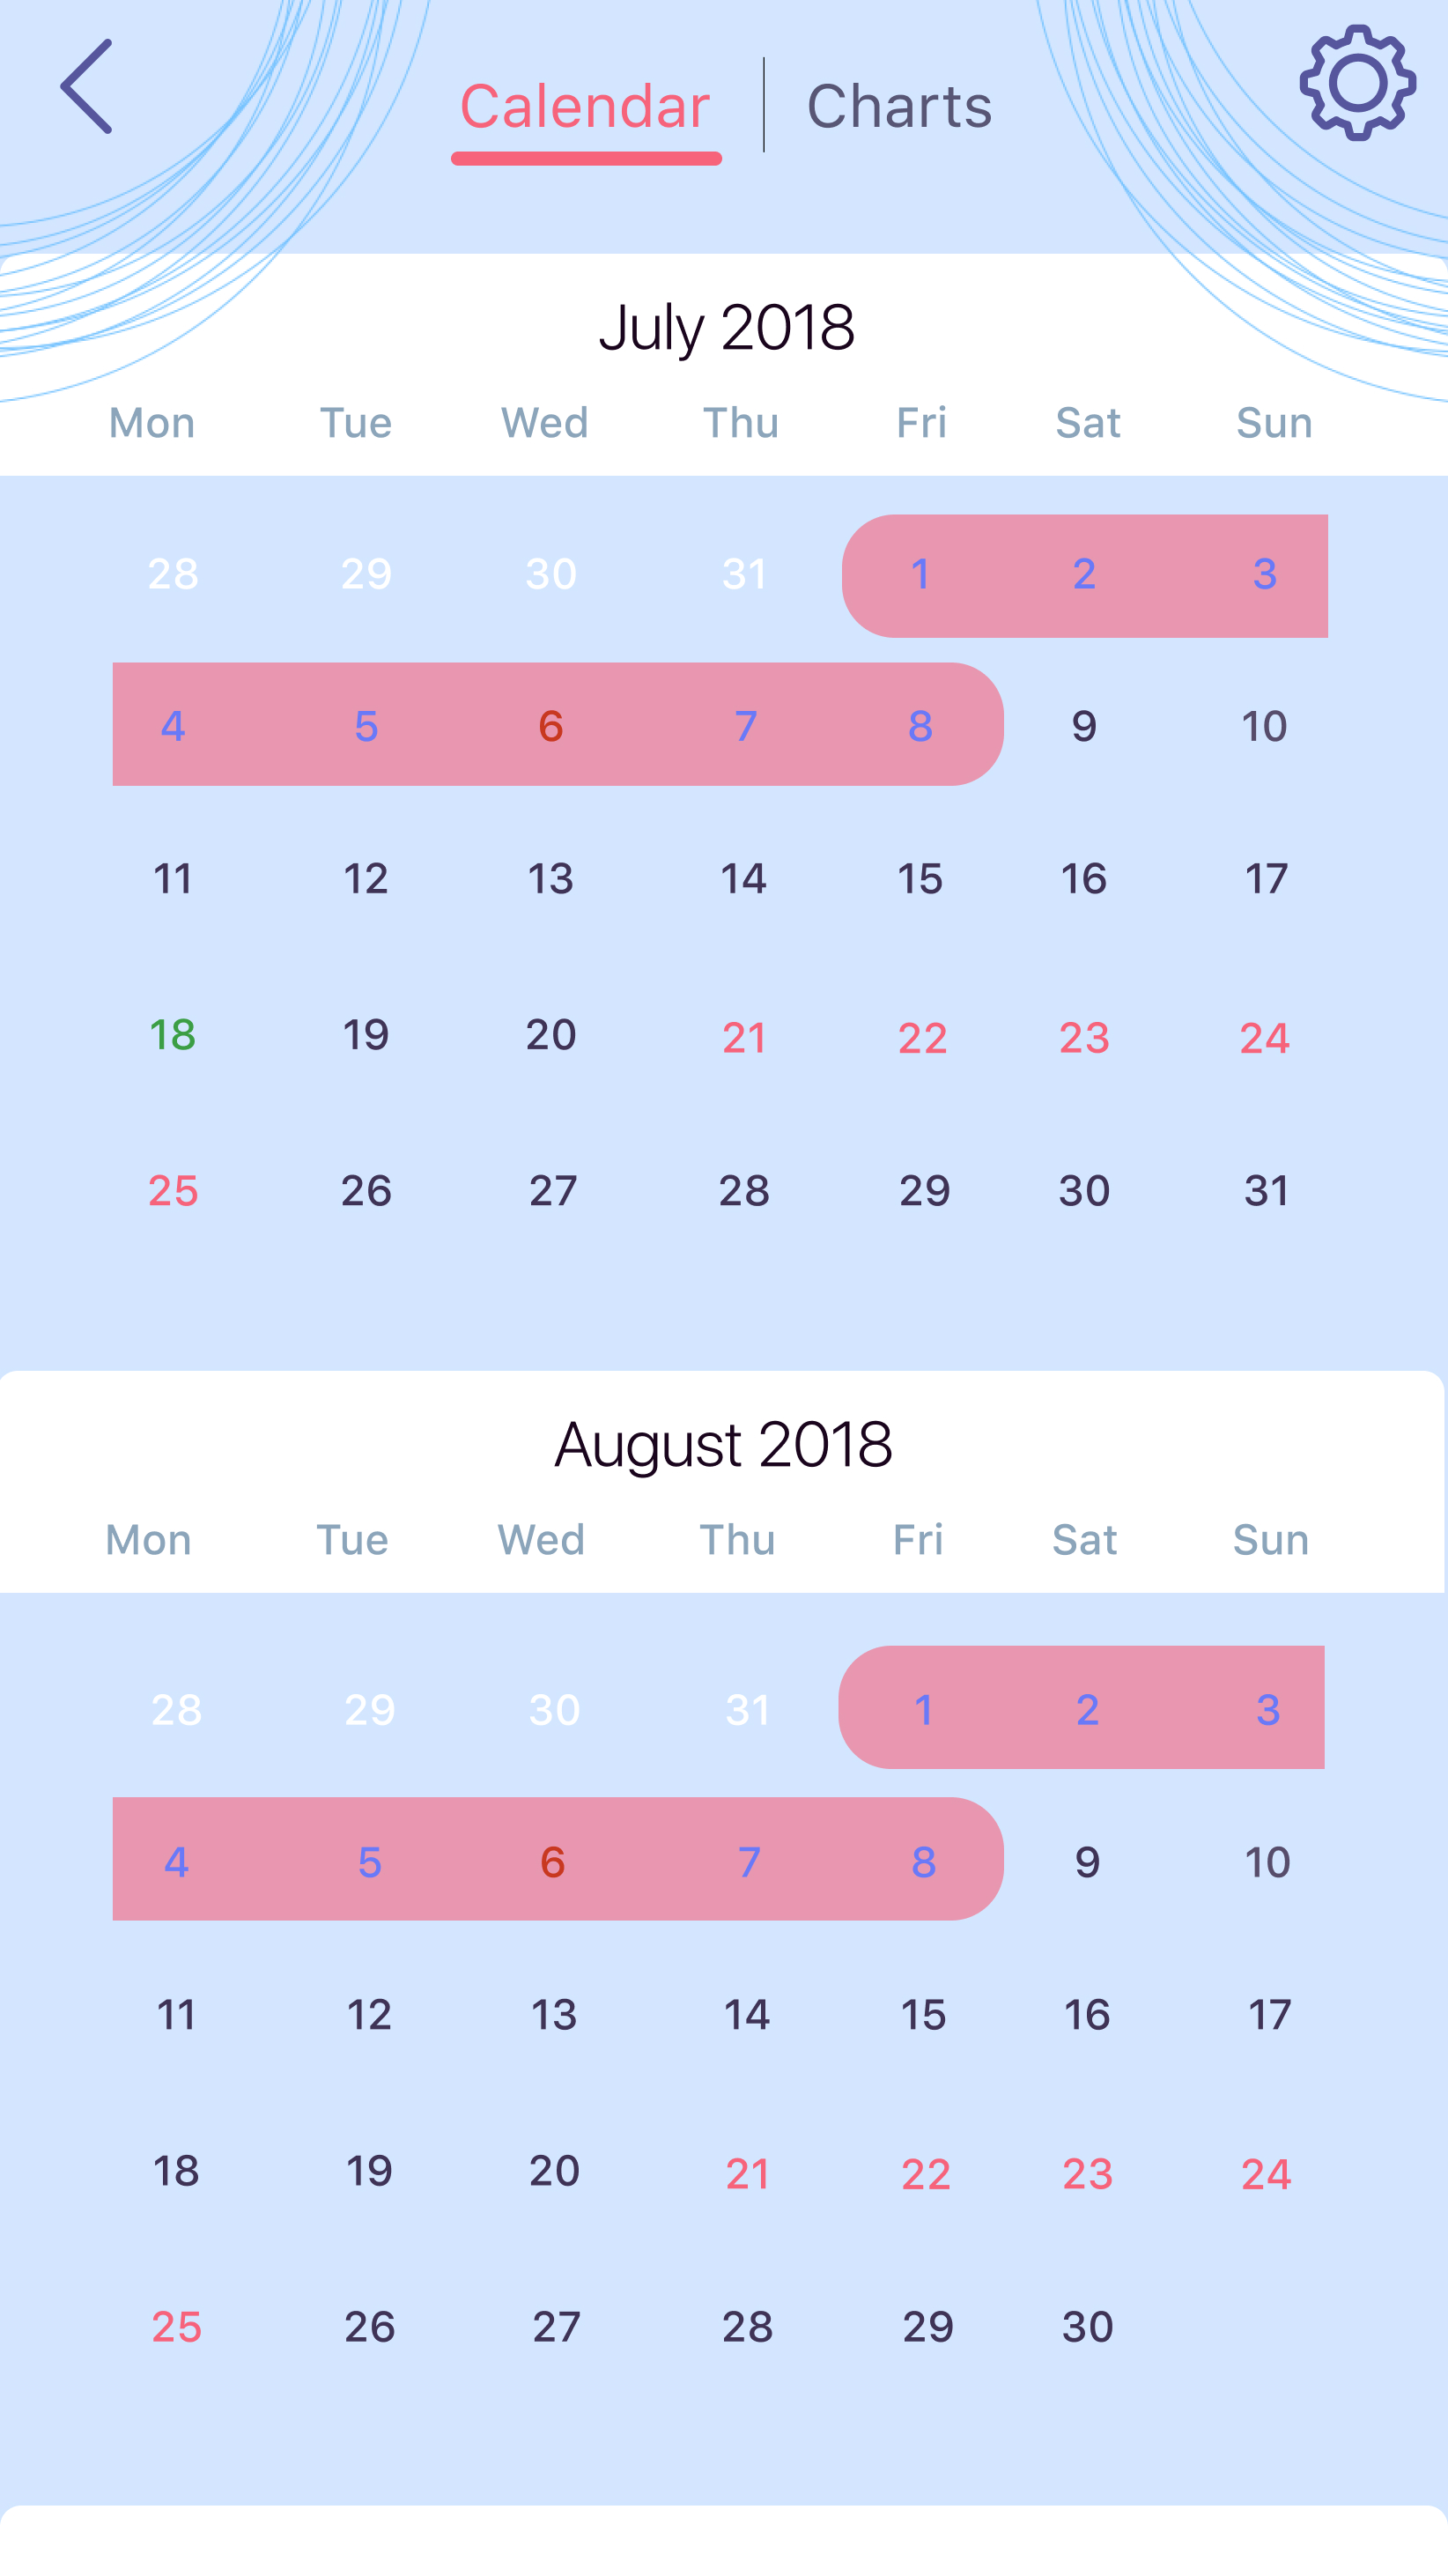
Another aspect that we want to improve on is visualization. The most common ways to visualize data in these fertility apps are calendar and graph. However, for calendar, the problem is it’s difficult to see the pattern of their data whereas for graph, the problems is there are only a few indicators offered. And in all the apps that we evaluated, most graphs go with pre-defined indicator which the user cannot modify.
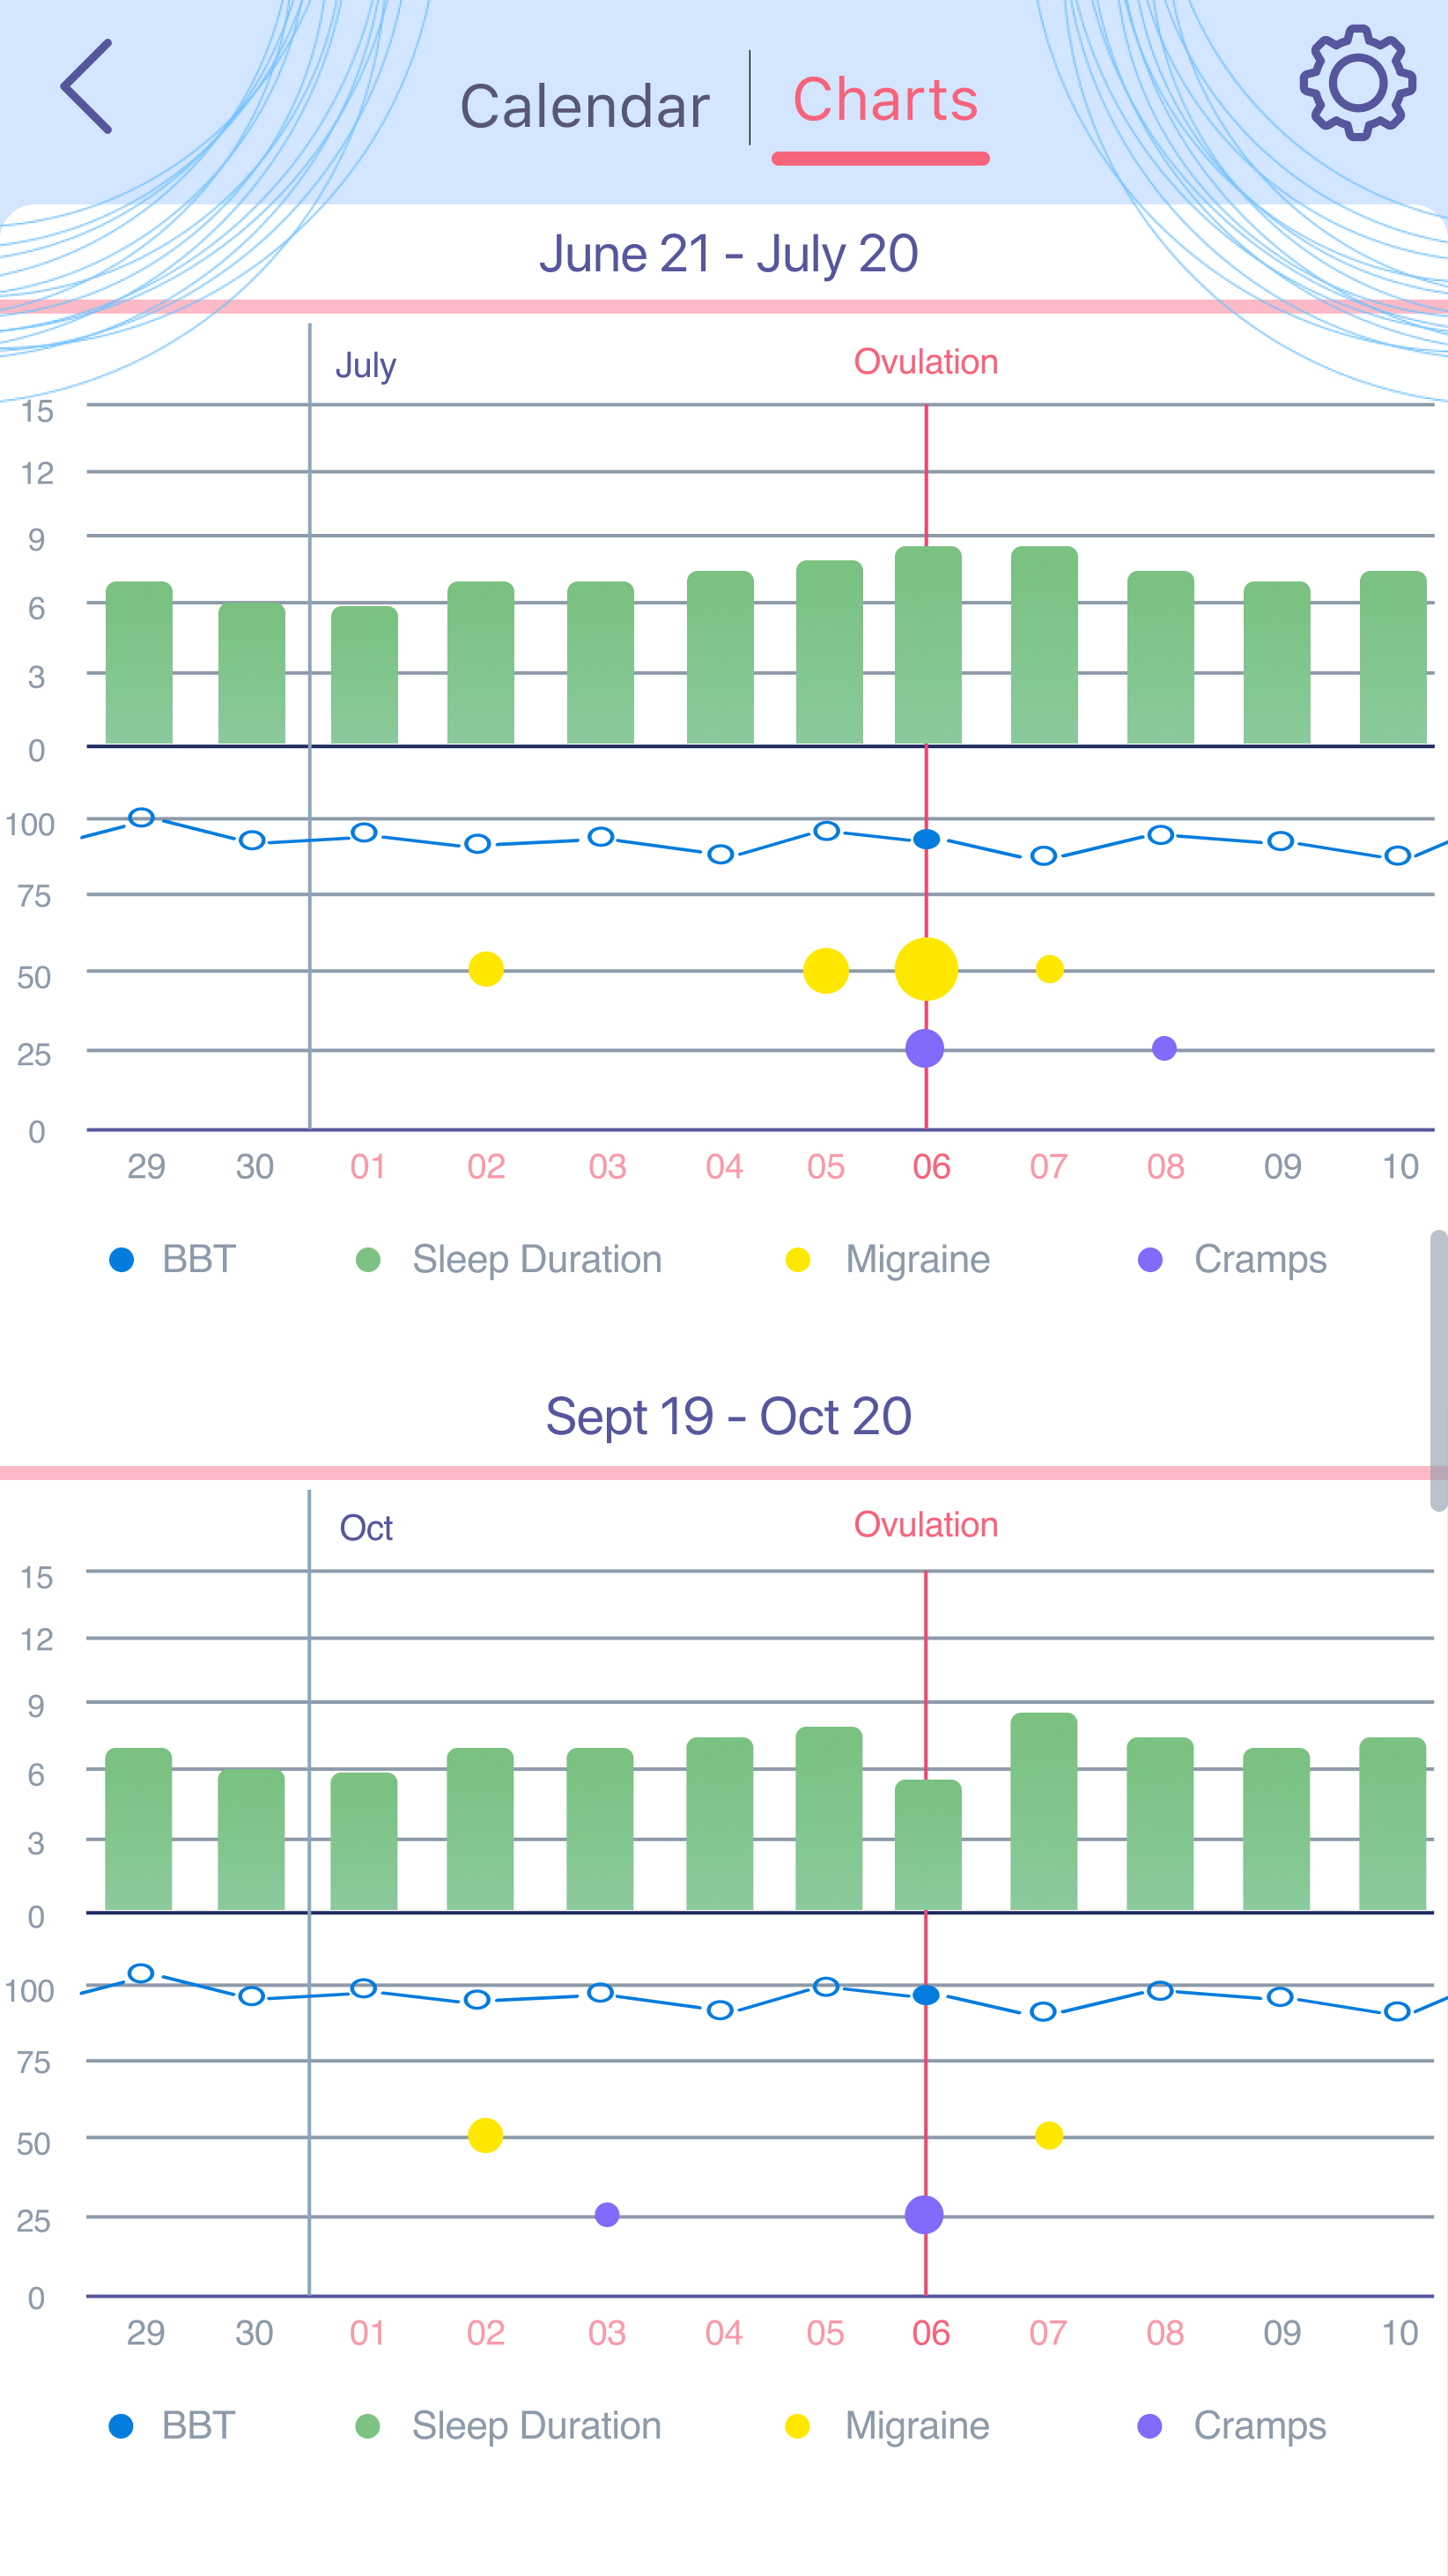
So our approach to tackle this problem is to provide the user customizable graphs in which they can remove or add indicators that they want to track. Since people with different goals have different needs, they want to see, analyze and compare different things. For example, people who are TTC want to see their BBT, or people who track their period may want to monitor their sleep duration and cramps. Or there’re some people just want to track their migraine and see how it changes throughout their cycles.
Below is our current design for the customizable graph. The user can scroll down and select the indicators that they want to track, and it will show up on the graph. In this case, this person want to track their BBT, sleep duration, migraine and cramps. They can also compare different cycles to each other.
| Select indicators | Compare cycles |
|---|---|
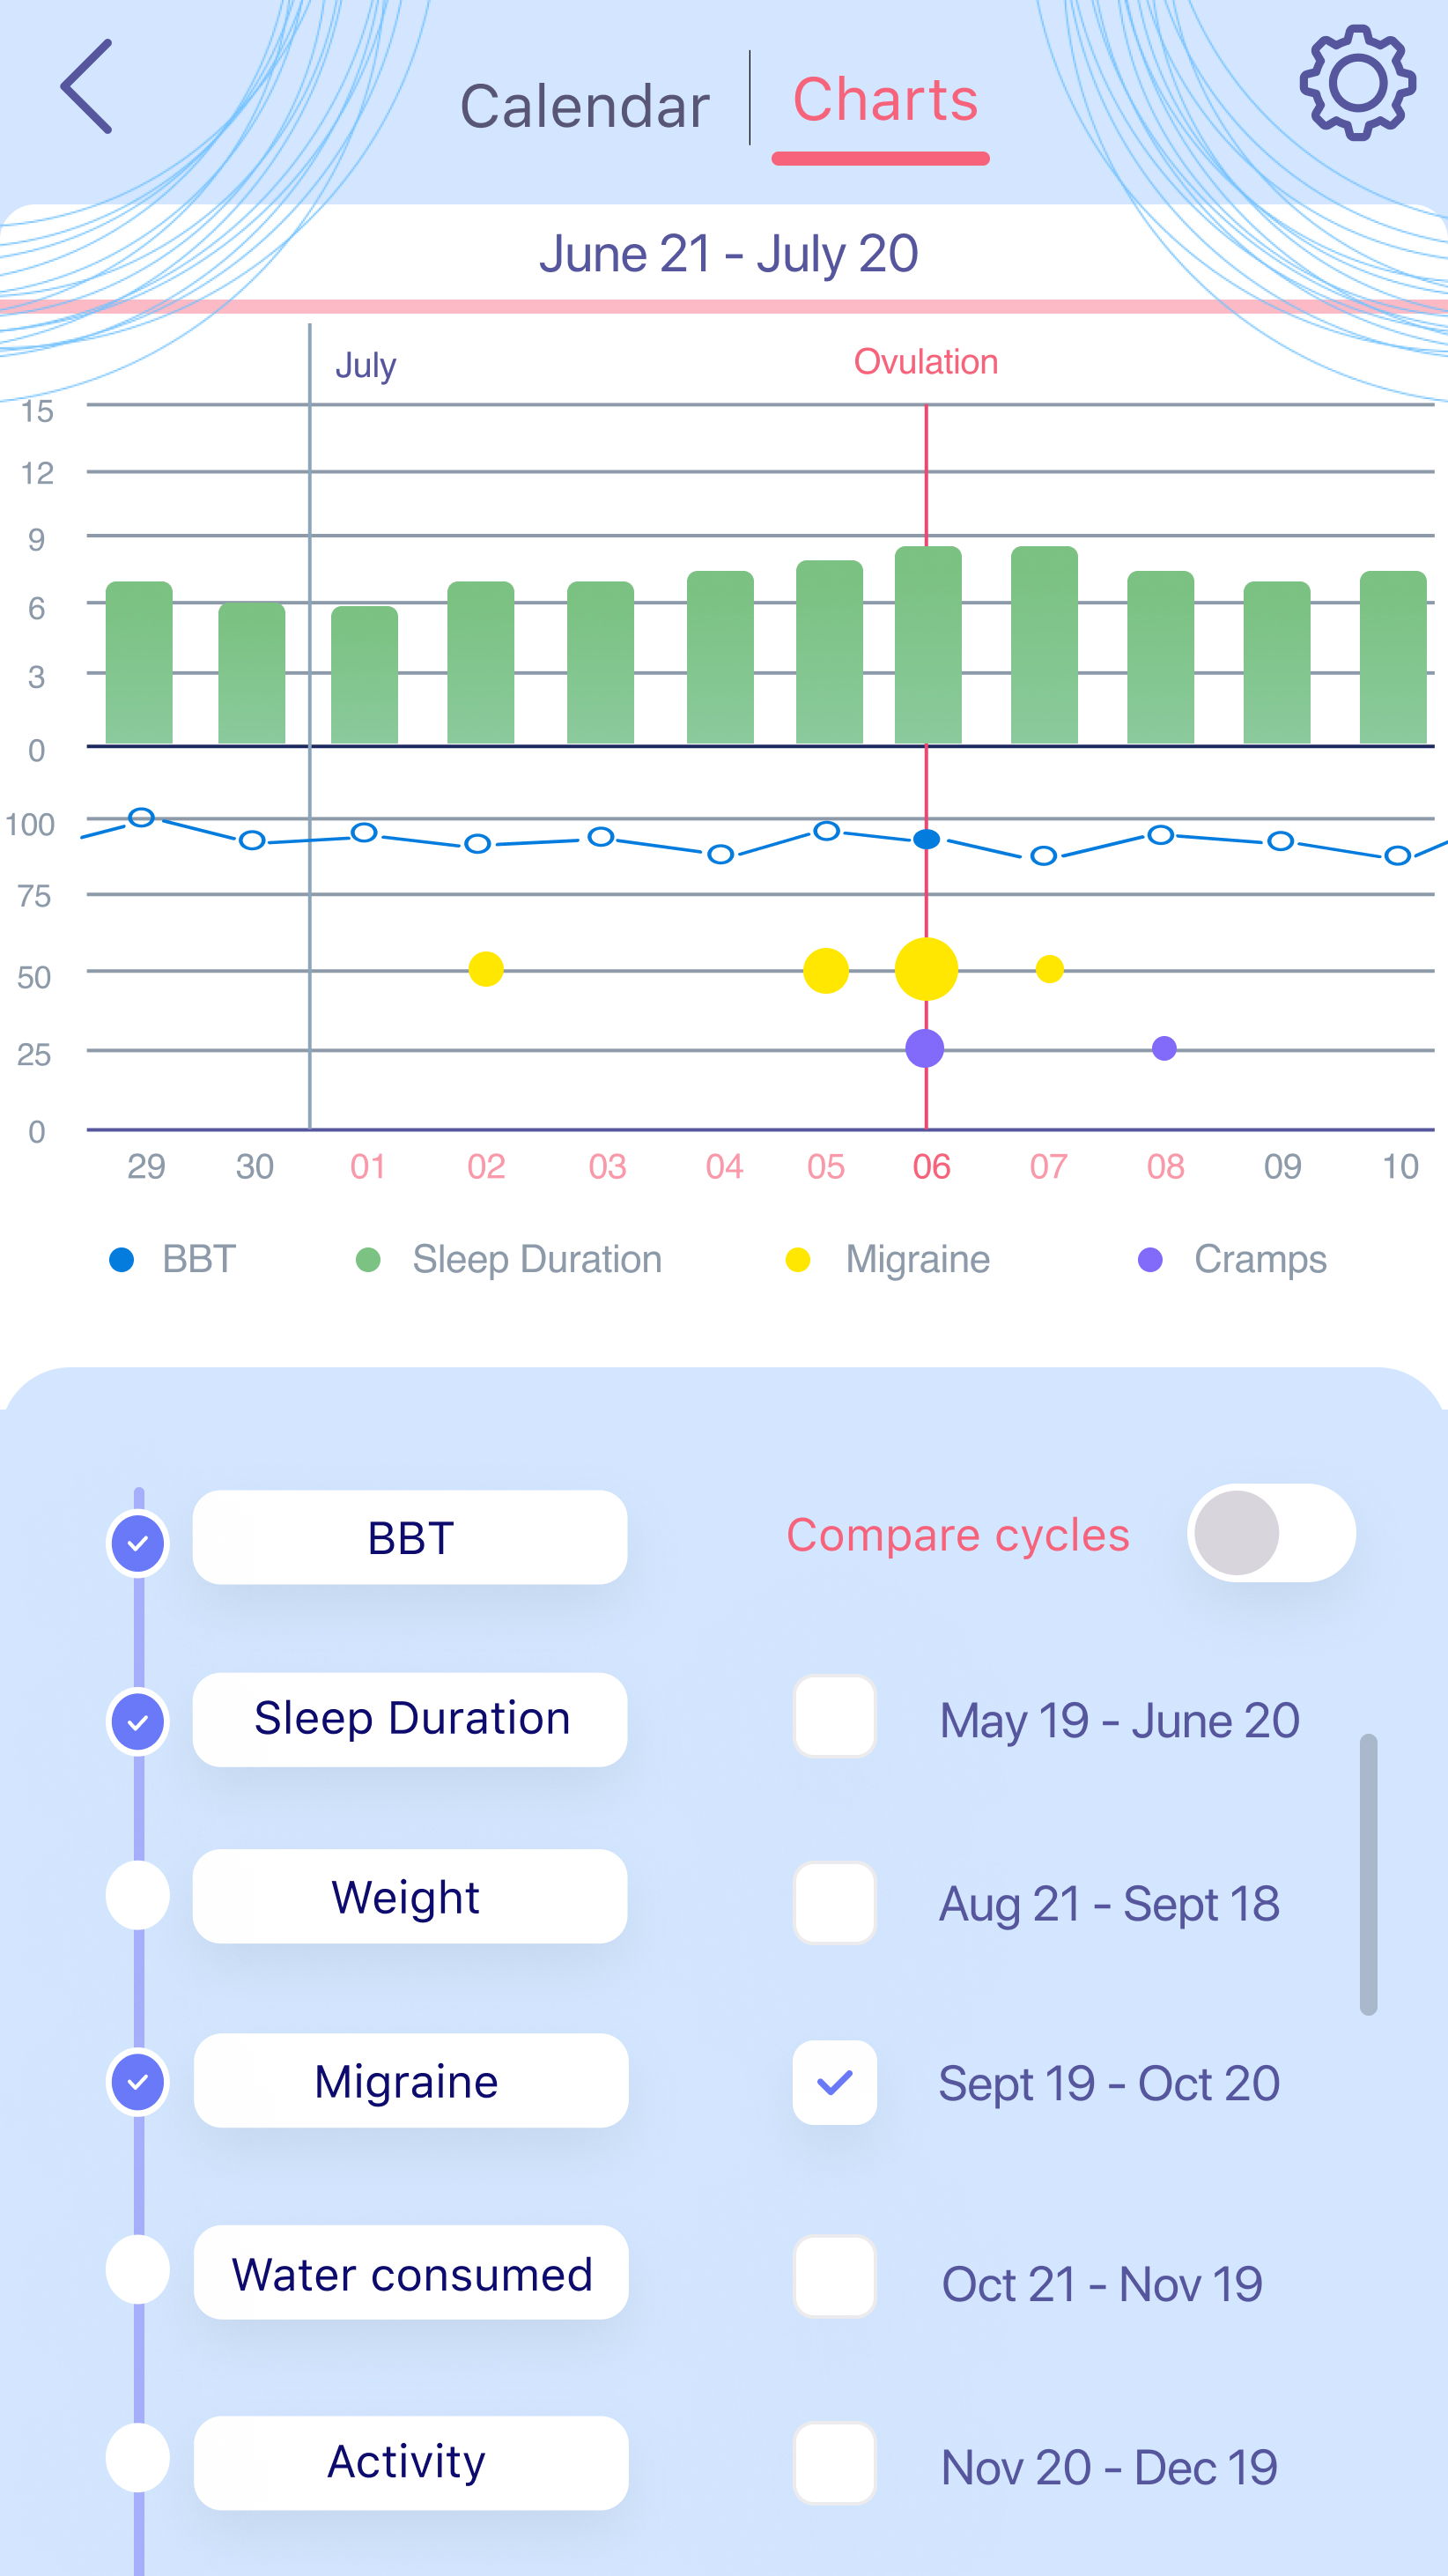 |
 |